Satellite: Difference between revisions
Jump to navigation
Jump to search
Clean up links. |
→Images: Burning Man satellite images |
||
| (8 intermediate revisions by the same user not shown) | |||
| Line 1: | Line 1: | ||
See also The Friends of Black Rock's [http://blackrockdesert.org/current-conditions/ current conditions] page. | See also | ||
The Friends of Black Rock's [http://blackrockdesert.org/current-conditions/ current conditions] page. | |||
== Visibility prediction == | == Visibility prediction == | ||
| Line 16: | Line 17: | ||
== Clips from MODIS realtime strips == | == Clips from MODIS realtime strips == | ||
* [[MODIS Terra 5 May 1140 PDT]] | * [[MODIS Terra 5 May 1140 PDT]] | ||
== How to see how wet the Playa has been == | |||
This is based in part on Laura's page [http://www.spatial-ed.com/projects/black-rock-desert-modis-images.html Black Rock Desert - MODIS Images - How wet was the Black Rock Desert this year?] from 2011. | |||
The basic idea is that we look for terra 7-2-1 MODIS data and display it | |||
# Go to https://worldview.earthdata.nasa.gov/ | |||
# Pan and zoom until you have a nice view of the Black Rock Desert | |||
# Click on the red "+ Add Layers" button | |||
# In the search window, type "terra 7-2-1" and click on the red box at the right of "Corrected Reflectance (Bands 7-2-1)" to select it. | |||
# Close the search window by clicking on the X. | |||
# Now you can change the time scale to make a movie or a gif. | |||
== Images== | |||
* [https://eros.usgs.gov/media-gallery/earthshot/burning-man Burning Man] (Earth Resources Observation and Science (EROS) Center) - Satellite images of Burning Man 1996-2022. | |||
* [https://eros.usgs.gov/media-gallery/earthshot/wet-dry-cycle Wet-Dry Cycle] (Earth Resources Observation and Science (EROS) Center) - Satellite images of the Black Rock Desert playa in 2017. | |||
== Local Images== | |||
<gallery> | |||
File:Satellite 5-4-1993 WetDry 7,4,2-labels.png|"An image from May 4, 1993, shows an interesting effect. Water from that year’s temporary lake was blown out of its bed to the north by a strong south wind. A shallow scarp, only 20–40 centimeters high, curves around the north edge of the playa and often marks the edge of the lake. But the blue color washes over the scarp in this image." (Earth Resources Observation and Science (EROS) Center) | |||
File:Nasa-worldview-2016-05-28-to-2017-03-31.gif|A false color animated GIF showing water on the playa from May 28, 2016 until March 31, 2017 | |||
File:BRD1June2017.jpg|June 1, 2017: False color image of water on the Black Rock and Smoke Creek Deserts. | |||
File:BlackRockDesertFalseColorShowingWater-2017-06-13-to-2017-06-26.gif | A false color animated GIF of water on the Black Rock Desert. The loop runs from June 13, 2017 to June 26, 2017. Note that the water recedes and advances with the wind. | |||
</gallery> | |||
== See Also == | == See Also == | ||
* [[Astronomy]] | * [[Astronomy]] | ||
Latest revision as of 16:05, 19 February 2023
See also The Friends of Black Rock's current conditions page.
Visibility prediction
When Satellites will be visible above the Black Rock Desert, Nevada
MODIS
MODIS is a satellite that images the Black Rock Desert Region.
Clips from MODIS realtime strips
How to see how wet the Playa has been
This is based in part on Laura's page Black Rock Desert - MODIS Images - How wet was the Black Rock Desert this year? from 2011.
The basic idea is that we look for terra 7-2-1 MODIS data and display it
- Go to https://worldview.earthdata.nasa.gov/
- Pan and zoom until you have a nice view of the Black Rock Desert
- Click on the red "+ Add Layers" button
- In the search window, type "terra 7-2-1" and click on the red box at the right of "Corrected Reflectance (Bands 7-2-1)" to select it.
- Close the search window by clicking on the X.
- Now you can change the time scale to make a movie or a gif.
Images
- Burning Man (Earth Resources Observation and Science (EROS) Center) - Satellite images of Burning Man 1996-2022.
- Wet-Dry Cycle (Earth Resources Observation and Science (EROS) Center) - Satellite images of the Black Rock Desert playa in 2017.
Local Images
-
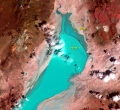 "An image from May 4, 1993, shows an interesting effect. Water from that year’s temporary lake was blown out of its bed to the north by a strong south wind. A shallow scarp, only 20–40 centimeters high, curves around the north edge of the playa and often marks the edge of the lake. But the blue color washes over the scarp in this image." (Earth Resources Observation and Science (EROS) Center)
 -
 A false color animated GIF showing water on the playa from May 28, 2016 until March 31, 2017
 -
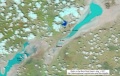 June 1, 2017: False color image of water on the Black Rock and Smoke Creek Deserts.
 -
 A false color animated GIF of water on the Black Rock Desert. The loop runs from June 13, 2017 to June 26, 2017. Note that the water recedes and advances with the wind.


